Teaching Students About Their Individual Affect on Air Pollution
Do your students understand their individual effect on air pollution? Are you teaching about the human impact on the environment(MS-ESS3-3) for Earth Day? Are your students finding it hard to relate to such an abstract and, let’s face it, invisible type of pollution?

written by
Karen Sinai
Teaching Students About Their Individual Affect on Air Pollution
Updated March 9, 2023
Teaching science, especially environmental science, is all about relating the topic to the students’ lives. You may find that the students have the attitude of “if it doesn’t affect me directly, then it’s not my problem”. In fact, that sounds like a lot of adults! So how can we bring the topic of air pollution directly into their lives?
Start with a Hook
I like to start my unit with a bit of mystery with an assignment that has the students scratching their heads. I ask them to track one driver in their family for a week. The student will interview that driver each evening to ask where they went, in their car, and approximately how many miles was each trip.
Gathering Car Data
I know what you’re thinking! That’s such private information! How can you ask students or parents to do this?! I reassure both the parents and the students that NOBODY will see any of their information, including me. Students keep a private log and use that to later create graphs. We NEVER see the raw data. I’ve been doing this activity for over 20 years and I’ve had only one parent who objected due to “she didn’t have time”.
Note: If you should run into a situation where the parent objects, or maybe there is no car, I have included some realistic data in my TPT activity for the student to use. No one will have to know. Another alternative is having the student track me. I have done that in the past with students whose parents work at home and basically would not have “interesting” data.
I tell my students that the parents should write down absolutely nothing. The STUDENT should interview their parent each evening.
They track their car for a week with with no clear idea as to the reason. However, as we learn more about air pollution, they start to get an idea. The buzz of students guessing makes it more fun!
Classifying Their Car Trips
When the week is over, the students bring in their data and I ask them to organize all of the trips into THREE categories. The first category is a “necessity trip” that had to be done. An example would be driving to work, a doctors appointment or to the supermarket for a weekly order. The second one is a “luxury trip” which was 100% not needed. An example would be driving to a nearby Rita’s to get water ice. The third is right down the middle and we call it “semi luxury”. This is the catchall for any trips that are not completely necessary, but are also not luxury.
Why do I keep it a mystery? For two reasons. The first is I believe mystery in the classroom leads to much more engagement and speculation. The second one is more realistic. I tell the students that if they were to try to figure out the three categories, with the help of their parents, there would probably be some family arguments!
For example, Mom might think that getting her nails done once a week is an absolute necessity. My sixth grade student, who is in the middle of an air pollution unit, is not likely to agree. When the students find out my second reason, they seem to like the fact that they are analyzing their family themselves.
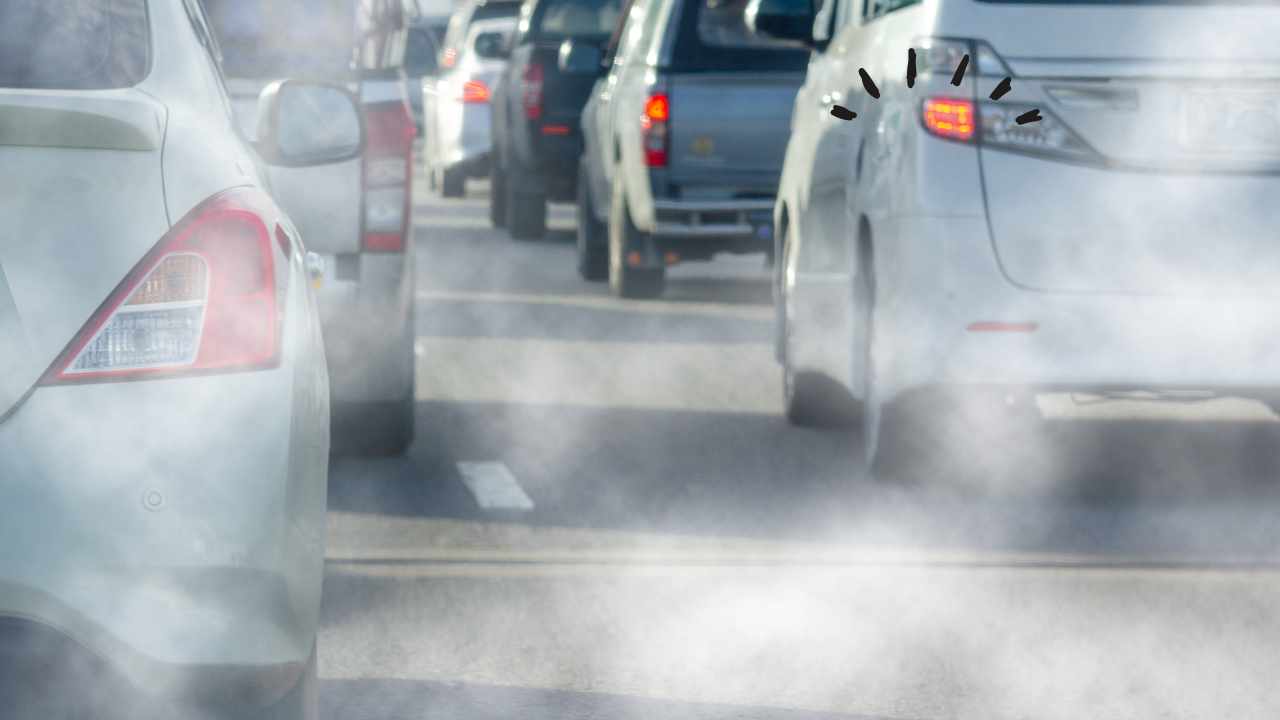
Let’s Collect Some Particulates
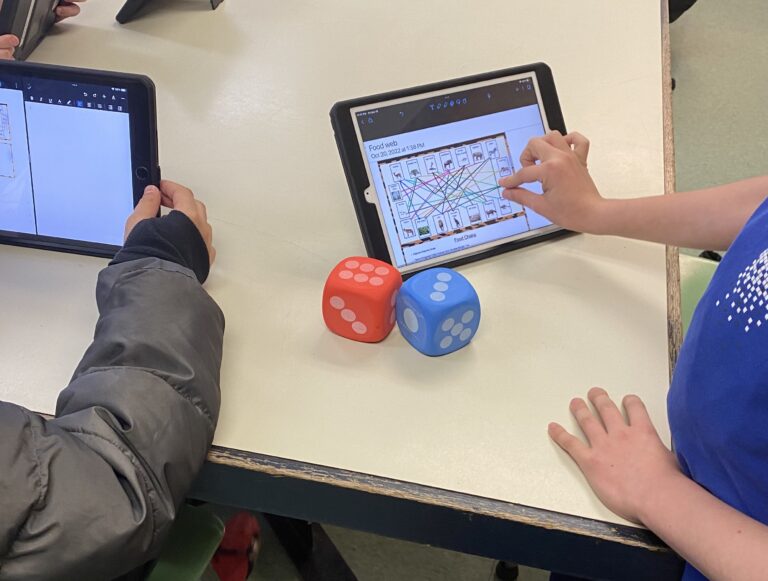
During the week that we are collecting our car data, I start introducing the concepts of types of air pollution. Holly from Flying Colors Science, has super ideas in her air pollution post. One is her activity involving smearing microscope slides with Vaseline and leaving them outside for a few days. When the students bring the slides inside they can look at the particulates under the microscope. Students are usually quite amazed at what has landed on the slide!
I tell my students about an activity I used to do years ago at another school. I borrowed car keys from several different teachers and we went out to the parking lot with our Vaseline covered microscope slides. Keeping the students at a safe distance, I turned on the cars and held the slide up to the exhaust pipe for 3 minutes. This was many years ago. There was one teacher who had a beat up 20 year old car that used to give us great particulates to look at under the microscope! I explain to my students now that most of the newer cars have much better technology to prevent that much pollution.
After looking under the microscope at the slides, the students try to figure out where the small black particles came from. How would the slides be different if you lived near a farm? Near a city? Near a power plant?
Local Air Quality
One of the great ideas that Holly talked about in her blog post, that I will definitely use next year, is going to www.airnow.gov. When you type in your school ZIP Code you get real time air quality information for your area! This really brings the concept home to the students. They realize that it’s not just a big city problem or something that happens in another country. It’s in their own backyard. This website is a great way to introduce vocabulary.
Time to Graph Our Car Data
After we divide the car trips into the three categories, we then move into graphing. Students use their data from their parents to add up how many MILES a day they traveled for luxury, semi luxury or necessity trips. Students enter this information into a spreadsheet using either Google Sheets, Numbers or even Keynote. They produce column graphs showing the miles data for the days, plus a summary pie graph.
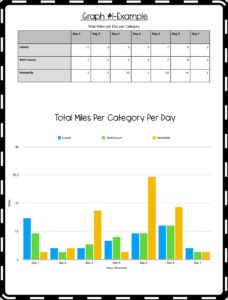
If this is the first time they have done graphing, then we do a simple graph or two before we get into using the data.
Students then break the data into how many TRIPS were done from the types of categories. We also create column and pie graphs. (All of the instructions are in my TPT project).
So why do we care about the kind of trips that we make with our cars? Let’s get to reading about this. Holly has some air pollution reading passages with questions (Sources of Air Pollution Worksheet)to give the kids a good foundation about the main types. While reading, they learn that the largest source of air pollution is the combustion of fossil fuels such as gasoline! Bingo. Now it makes sense!
What are Some Realistic Changes Students Could Make?
We look at their family data graphs and answer questions about what we could do to reduce these trips. Are there realistic ways that they could cut down the amount of air pollution their family uses? Could they run errands in an organized way so that they don’t keep going out and back home again over and over? Could they save their shopping list and go once a week to the supermarket, rather than going every day? Is it really necessary to drive 5 miles to go play basketball at the gym? This one really starts some big discussions in the classroom! Do your parents drive you to school, because you want to sleep in, but you could’ve taken the bus? This leads into a good discussion about the benefits of using public transportation
It’s Time to Learn the Details
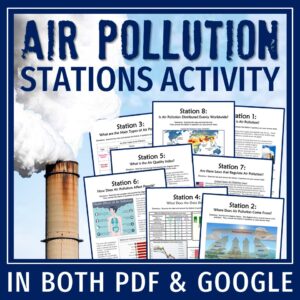
Now for the meat and potatoes of the unit. Holly has created eight stations with activities that students visit around the room gathering information to answer questions on a worksheet. Each station has a different task which makes it a fun break from the normal classroom routine. Students are always satisfied when they complete the circuit successfully!
Finish With an Air Pollution Scavenger Hunt
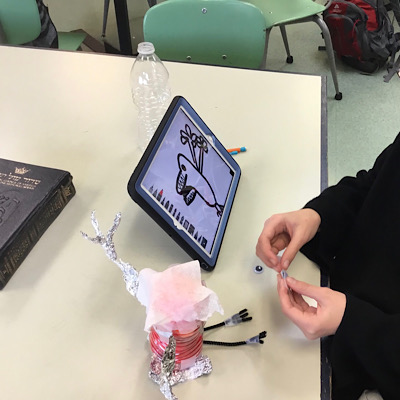
I like to finish my unit by having the students go outside with their iPad cameras. We walk all around the schoolyard and look for sources of air pollution for them to photograph. This may include a picture of a car muffler, an exhaust vent on the top of a house, pollen on the hood of a car, a chimney, a dusty playground, an air conditioner, etc. We take the photographs and make a PowerPoint presentation that includes their graphs and station work.
I love watching the excitement of the students really looking around and applying their knowledge as they look for something to photograph. Wasn’t that my goal? Yes! I wanted to bring this vague idea of air pollution down to their ordinary lives. I wanted them to think just a little bit deeper about their personal affect on air pollution.
More Human Impact and Earth Day Blog Posts
Check out my other human impact and Earth Day blog posts:
10 Environmental Activities for Earth Day
Inspiring Middle School Students to Minimize Their Impact on Municipal Waste
Teaching Students About the Threat of Invasive Species
Design Water Filters with This Exciting STEM Project!
Identifying Pond Water Microorganisms as Bioindicators

- Embracing The Mess: Why a “Messy” Science Classroom is a Good Thing
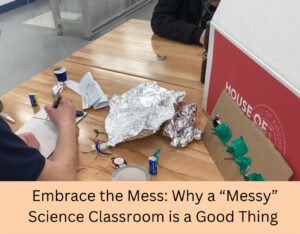 Embracing The Mess: Why a “Messy” Science Classroom is a Good Thing Do you have a messy science classroom? Are supplies scattered everywhere, with half finished…
 - Why Digital Science Notebooks Make the Ultimate Study Guide
 Why Digital Science Notebooks Make the Ultimate Study Guide Do you find that your students don’t know how to study for tests?Are they losing papers, forgetting…
 - 10 Tips For Engaging Disinterested Students
 10 Tips For Engaging Disinterested Students We all know the struggle of engaging disinterested students no matter how hard we try. Over the years, I’ve found…