Inspiring Middle School Students to Minimize Their Impact on Municipal Waste
Do your students have any idea of their personal impact on municipal waste? Are you introducing a unit on human impact as part of the NGSS standard MS-ESS3?

written by
Karen Sinai
Inspiring Middle School Students to Minimize Their Impact on Municipal Waste
February 2023
Let’s start the unit with relatable scenarios. Your mom asks you to clean your bedroom. You are so proud of the big bag of garbage and so is your mom! You take it out to the trash cans and … forget about it.
You’re going on a road trip with your family and you need easy food to distribute in the car. You go to the supermarket and pick up juice boxes, prepackaged potato chips and pre-peeled oranges wrapped in plastic. You also grab some paper plates and cups, plus some plastic forks and spoons. After you eat, you stop to dump out the trash at the next rest stop and… forget about it.
Where does it go? The garbage truck? Where does the garbage truck go? Most students have NO IDEA!
What is a Landfill?
What is a landfill? What is a recycling plant? Honestly, when I first started teaching this, I had to Google where the nearest landfill was to the school. It turns out it is less than 20 minutes away!
We look at photos of landfills and compare a landfill to the dumps from the past. Where did people put their trash 100 years ago? 200 years ago? What’s the difference between the trash 200 years ago and the trash today? Most students will come to the conclusion that we have increased the use of plastics and many chemicals.
Do you think people 200 years ago thought about their impact on municipal waste?
Why are landfills a problem? All of the liquids in the garbage, think of the bottom of your outdoor trash can, can drip down to contaminate our groundwater. This is called leachate and must be disposed of carefully and expensively. Methane is a gas that is released from bacteria breaking down the trash. It is highly explosive and is involved in the greenhouse effect.
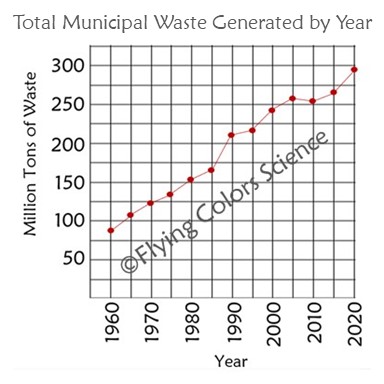
We move on to use Flying Colors Science’s Graphing Garbage activity where we create a line graph to show the total amount of trash generated from 1960 until 2020. It has an alarmingly steep upward slope with a difference of 88 million tons in 1960 to 295 million tons in 2020! Students answer reflection questions about WHY this increase may have occurred.
How Much Trash is Produced?
How much trash does each person produce? When I tell the students that they produce about 4.5 pounds a day they are very surprised. I fill up a plastic bag with miscellaneous items that come to a total of 4.5 pounds and let them feel the weight. How much do you make in a month? A year? Ouch!
So WHY do we all generate so much trash? A lot of it has to do with a culture that has changed in the last few decades. Things became disposable. “Just throw it away!”. “It’s so easy! Use it once and toss it!”. “So convenient”. Problem is, no one stopped to think about WHERE it was tossed.
Packaging Has Gotten Worse
Packaging has changed over the years. Manufacturers use the packages as a method of advertisement and use a lot more plastic, cardboard and ink to promote their products. This has had a huge impact on municipal waste!
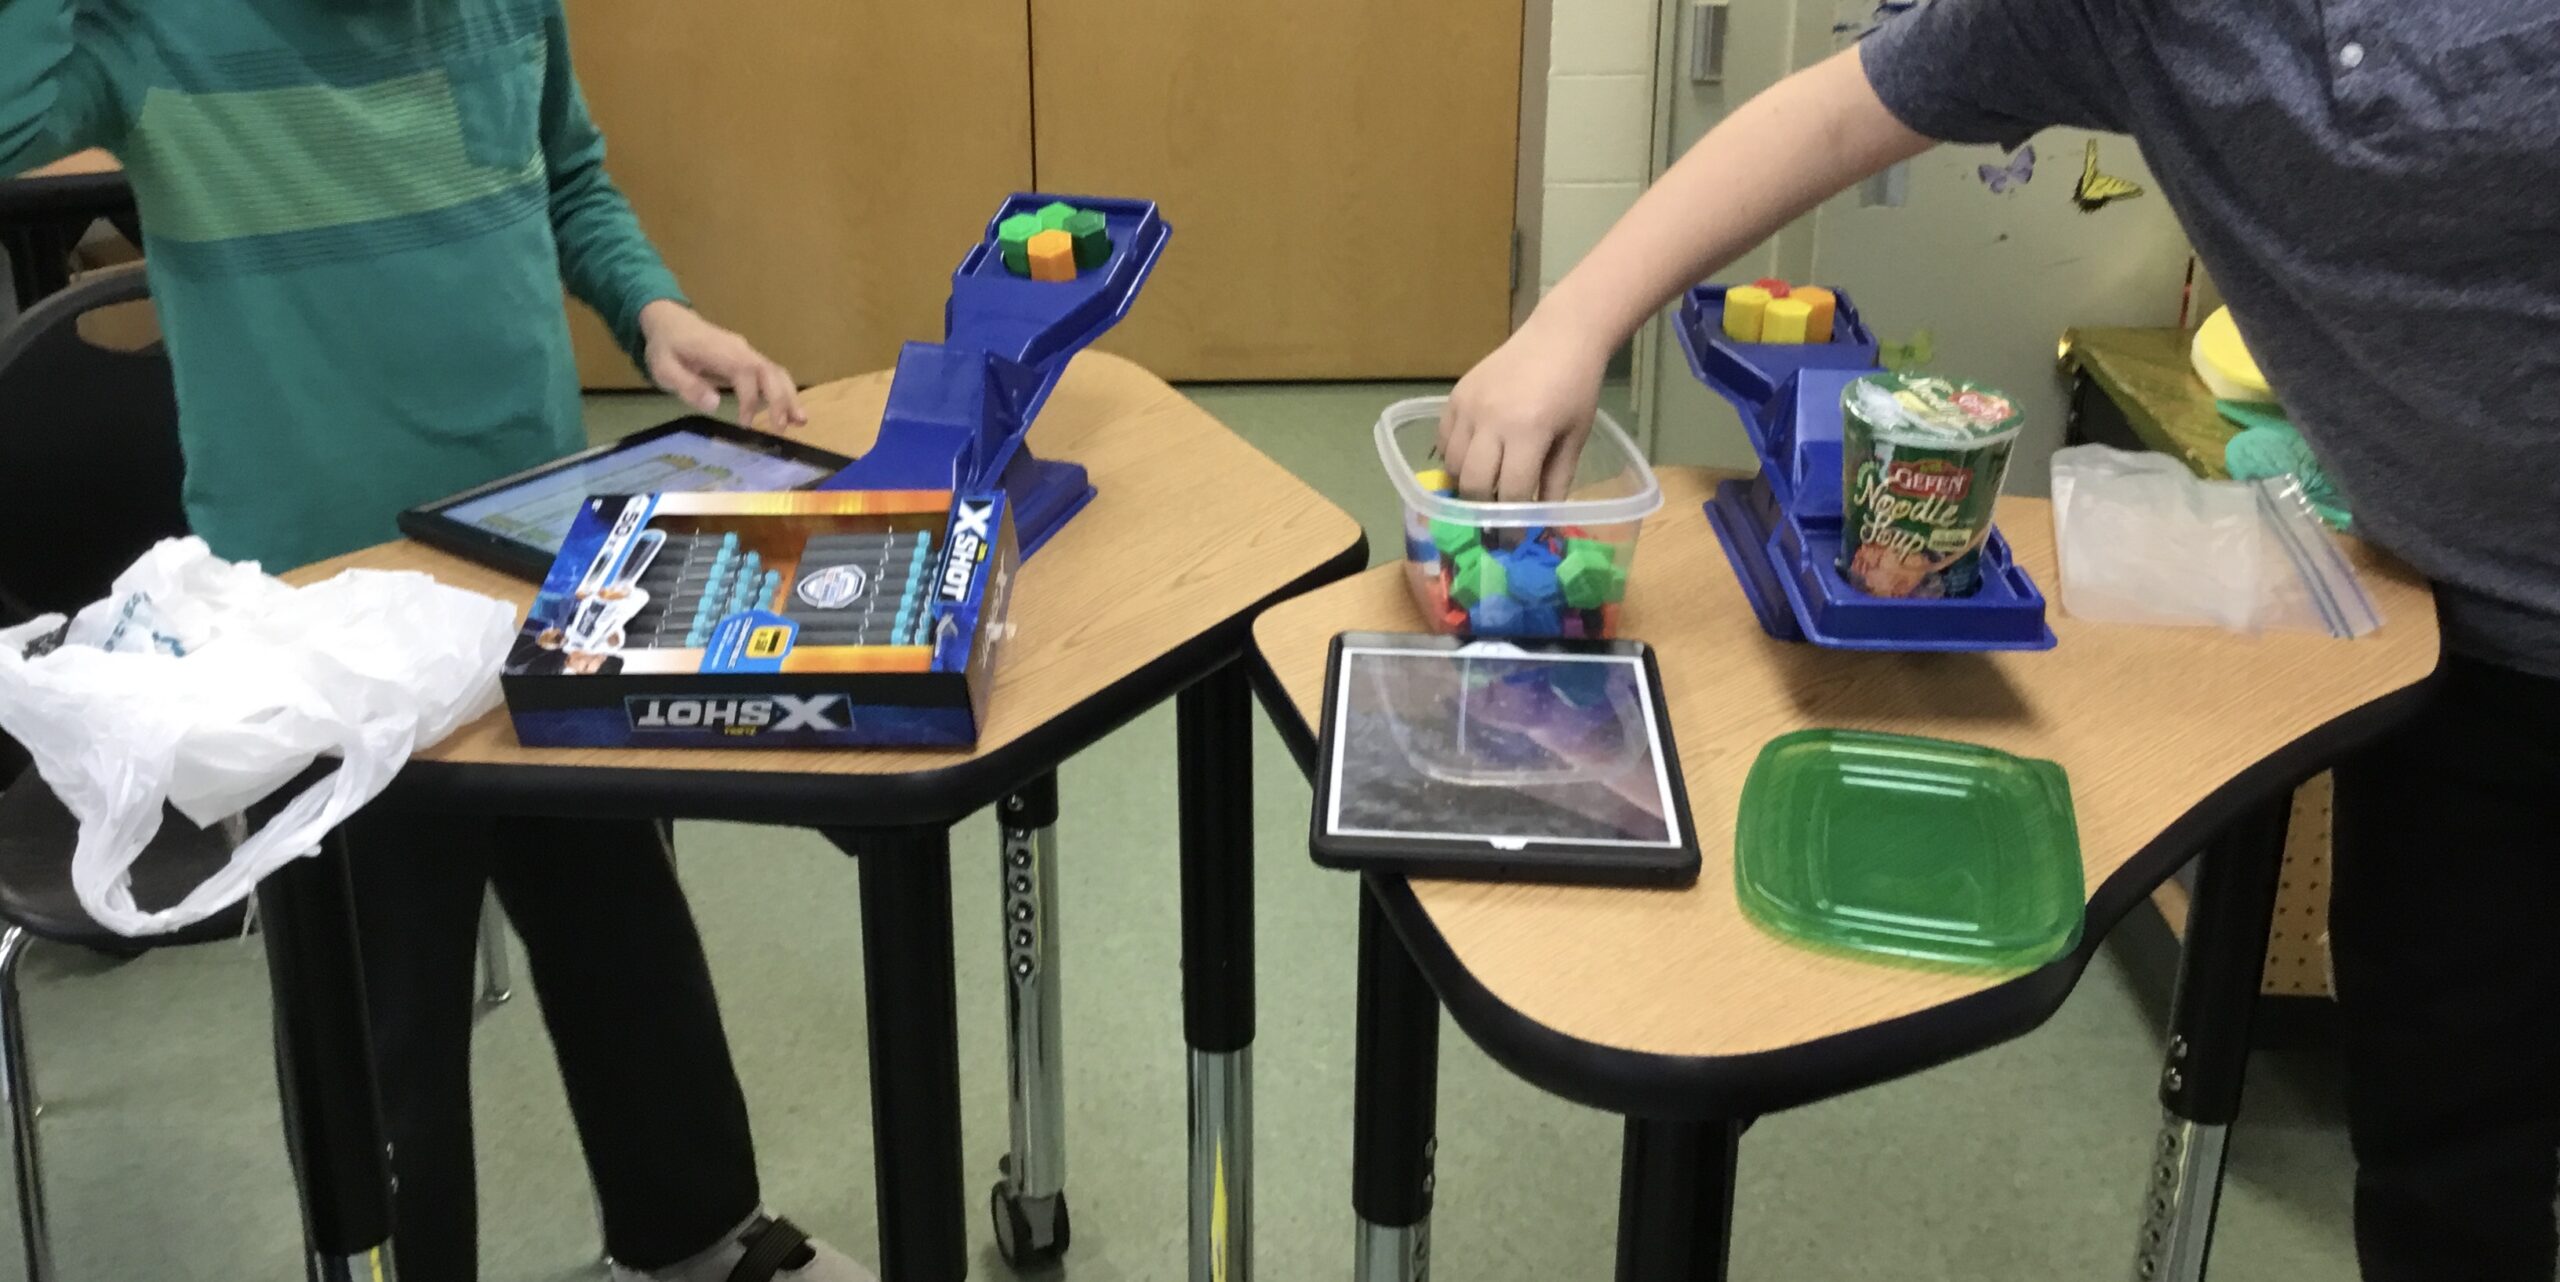
I tell the students a story of when I used to sell toys on eBay. One of the hottest items was a Harry Potter stationery set that included a few pencils, pens, erasers, pencil sharpeners, a small notepad and a few other trinkets. However, the cardboard packaging was about 17in x 17in in the shape of the Hogwarts castle, with lots of molded plastic to show off the actual items.
I remember getting an email from a buyer in Australia asking if I would be willing to take the stationary items out of the packaging and ship them alone. Once I made a small pile of only the product, it took up only a THIRD of the original package! So much cheaper to ship!
I started to REALLY think about it. I would have been shipping 75% TRASH in the form of pretty packaging!
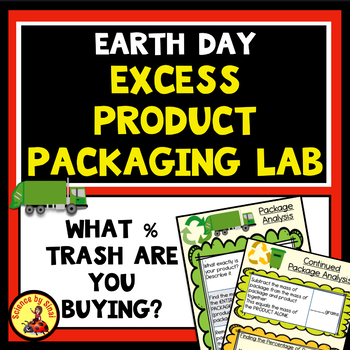
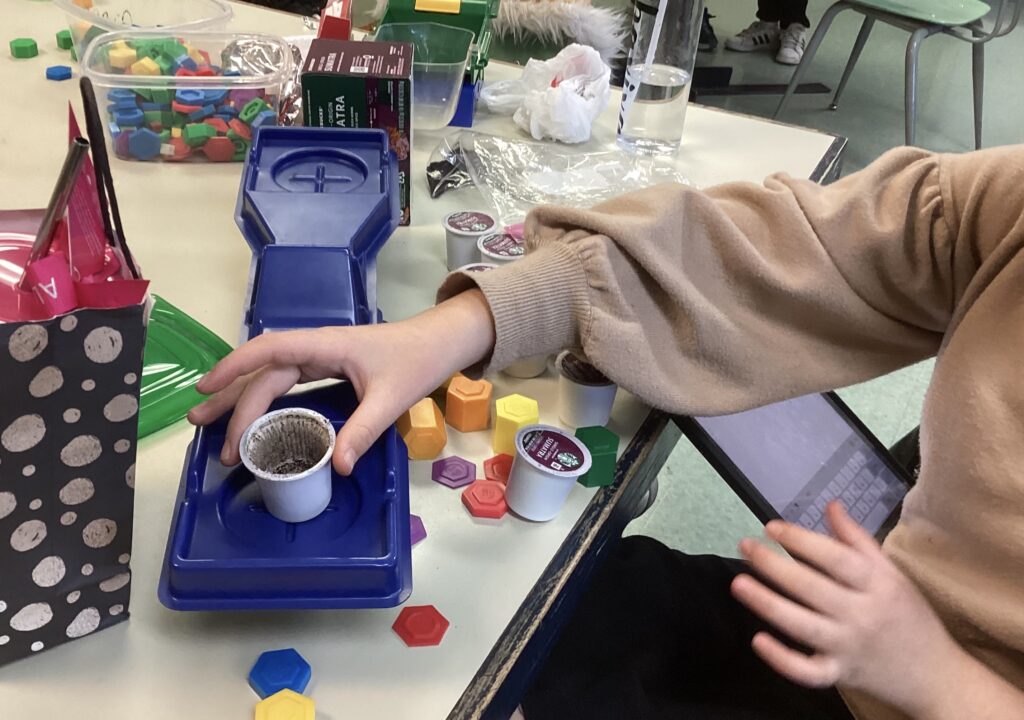
This story led to me developing a now yearly lab called Excess Product Packaging Analysis Lab that I do with the students. It really hits the point home about over packaging. Students bring in a package of their choice and we take it apart, separating the package from the product. We find the mass of the package alone and the product alone and find the PERCENT TRASH. Students are floored that quite often our numbers are close to 50% trash!!
I keep repeating that they are buying 50% garbage! Whatever they paid for their product was double the value of the product.
What Materials Make Up Our Municipal Waste?
That’s when the REAL discussions begin. WHY do they think their product was packaged the way it was? Was it for sanitary reasons? Safety? Anti theft? Advertising? How would they design it differently?
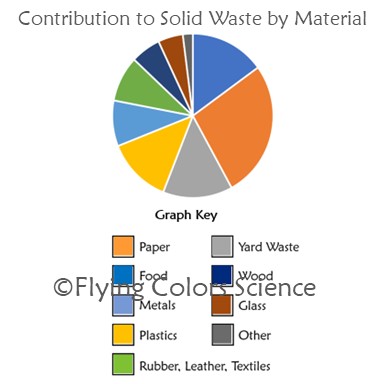
What materials were used in their package? Where will it go once put in the trash? This is when I have them do Flying Colors Science’s Graphing Garbage #2 showing what percentage of each type of waste goes to a landfill. They create a pie graph that shows the breakdown of paper, plastic, glass, wood, food, etc that is thrown out. She has a super blog post all about how she uses these graphs and reading passages in her Land Pollution Lesson Plan. It’s a great read!
Let’s Talk About Recycling
So does it all have to go to the landfill? Let’s talk recycling. How do you know if a material can be recycled? If students live in an area that recycles, they likely have a bin in their kitchen for glass, paper, plastic and aluminum. Can they throw all plastics in the bin? How do you know which you can and can’t? It is the numbers on the plastic package.
Most years, when I mention the plastic type numbers, the students have NO CLUE what I’m talking about. They may have noticed the famous “recycle triangle” on the bottom of their water bottle, but never thought much of it.
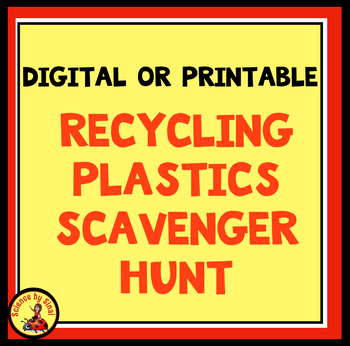
It’s time to go on a plastic scavenger hunt!
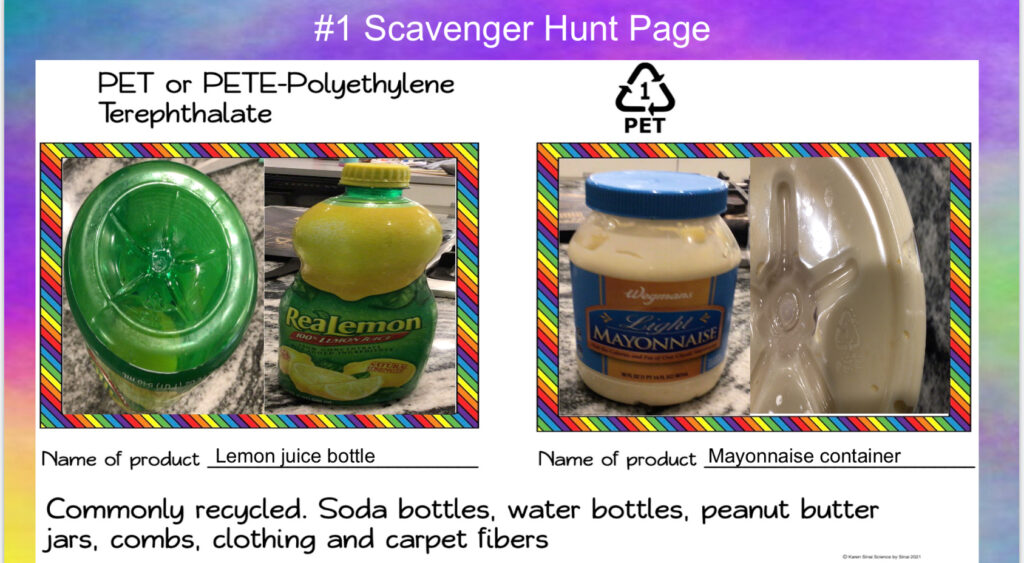
My activity has a slide for each plastic type number, #1 through #7, that is found on the bottom of plastic packages. Students travel all around their houses searching for two examples of each. Not so easy! By far, the easiest to recycle is #1(clear water bottle) and #2(translucent milk jug), which are also the most common. The other numbers are much harder to find.
What does it mean if you have a plastic product with NO number? It’s a blend of plastics and is UNRECYCLABLE.
I have students and parents tell me that the scavenger hunt became a family project as they searched throughout their houses! My students have iPads(How I Use Digital Science Notebooks to Maximize Student Learning) so they take pictures of the product, and number, to put on the slides. One year we didn’t have the iPads, so they simply wrote the product name in the colored boxes.
We visit the local township websites to see which plastics are allowed in the home recycle bins in our area. Quite often, it is only #1 and #2. Numbers three through seven are not as easy and cost effective to recycle.
What Actually Gets Recycled?
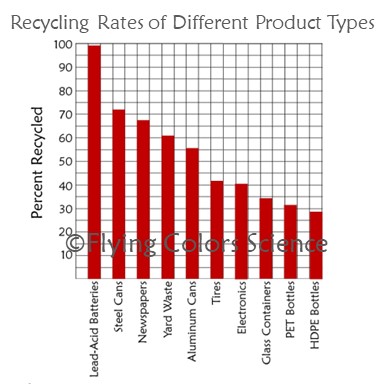
So out of that recycling bin in our kitchen, what percentage actually gets recycled? We use Flying Colors Science’s Graphing Garbage once again to graph the percent of batteries, aluminum, plastic, etc that got recycled in the year 2020. Students are surprised to see how little plastic is actually reused!
I like to bring in a discussion about the Great Pacific Garbage Patch, which is an area off the California coast with floating small pieces of plastic about the size of three states of Texas!
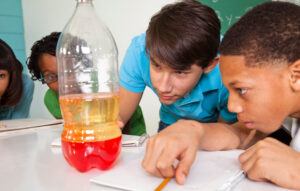
Some plastics will float and some will sink. Flying Colors Science does a dramatic demonstration using a milk jug and a soda bottle cut into 1 inch pieces and put into a jar of water. The milk jug will float, as HDPE plastic(#2), and the soda bottles will sink as PET(#1) plastic.
A discussion about how this affects different wildlife can be very eye-opening. Sea birds may think that the small pieces of plastic are fish eggs and fill their bellies, and their baby’s bellies, with the plastic pieces and pellets. Sea turtles may mistake the movement of a plastic bag underwater for their favorite food of jellyfish. The plastic may choke them or clog their intestines. This tugs at the heart strings of even the toughest kids!
This minimizing the impact on municipal waste unit gets great discussions going, especially as you move into more human impact studies or approach Earth Day. Please check out my blog post, 10 Environmental Activities for Earth Day or Everyday where I discuss many other activities that concern the conservation of our earth.

- Embracing The Mess: Why a “Messy” Science Classroom is a Good Thing
 Embracing The Mess: Why a “Messy” Science Classroom is a Good Thing Do you have a messy science classroom? Are supplies scattered everywhere, with half finished…
 - Why Digital Science Notebooks Make the Ultimate Study Guide
 Why Digital Science Notebooks Make the Ultimate Study Guide Do you find that your students don’t know how to study for tests?Are they losing papers, forgetting…
 - 10 Tips For Engaging Disinterested Students
 10 Tips For Engaging Disinterested Students We all know the struggle of engaging disinterested students no matter how hard we try. Over the years, I’ve found…