Teach Longitude and Latitude While Plotting Earthquakes and Volcanoes
Can your middle school students read a map? Can they plot a point using longitude and latitude? Do we even need to teach this with GPS so readily available?

written by
Karen Sinai

Teach Longitude and Latitude While Plotting Earthquakes and Volcanoes
January 2025
I realized my students had trouble using longitude and latitude when we were halfway through my plate tectonics unit. We were getting ready to plot earthquakes, and they looked at the longitude and latitude data like it was written in another language!
That’s when I knew I had to back up and start with the basics. And yes, I do believe it’s still a necessary skill, even in our GPS world.
Why Does Map Reading Matter When We Have GPS?
This is the question you’ll constantly be asked. Remind your students of how fascinated they are while playing with Google Earth’s “big picture.” They love zooming in from space to get closer and closer to their house! GPS alone gives you directions but doesn’t show you relationships or how locations are related.
I share the example of how necessary a map was when I moved south to Florida from New Jersey. At first, I relied entirely on GPS to get to appointments and stores, but I wasn’t understanding how things were laid out.
I’d get to important places, but I wasn’t comfortable exploring until I started really looking at maps, learning which streets ran parallel, and figuring out how towns connected. I needed the big picture to feel like I understood the area.
I also tell my students a story of when my family was traveling through the Smoky Mountains, completely relying on GPS for hundreds of miles. Suddenly, it stopped working because of the tall mountains. We panicked, unsure where to go.
We were stopped at the side of the road when finally a motorcyclist saw us looking lost and pulled over. He pulled a massive map from his backpack, spread it out on our car hood, and helped us figure out where we were and where we needed to go. Without that map, we could’ve ended up miles off track in an area with no gas stations, no signal, and no help!
Why Map Skills Still Matter
Learning to read a map isn’t just about finding places—it’s about spatial awareness and critical thinking. When students start looking at maps, they see connections that GPS can’t show. Why do they love Google Earth? Because it shows their house, neighborhood, and school from a perspective(from above) that they rarely see!
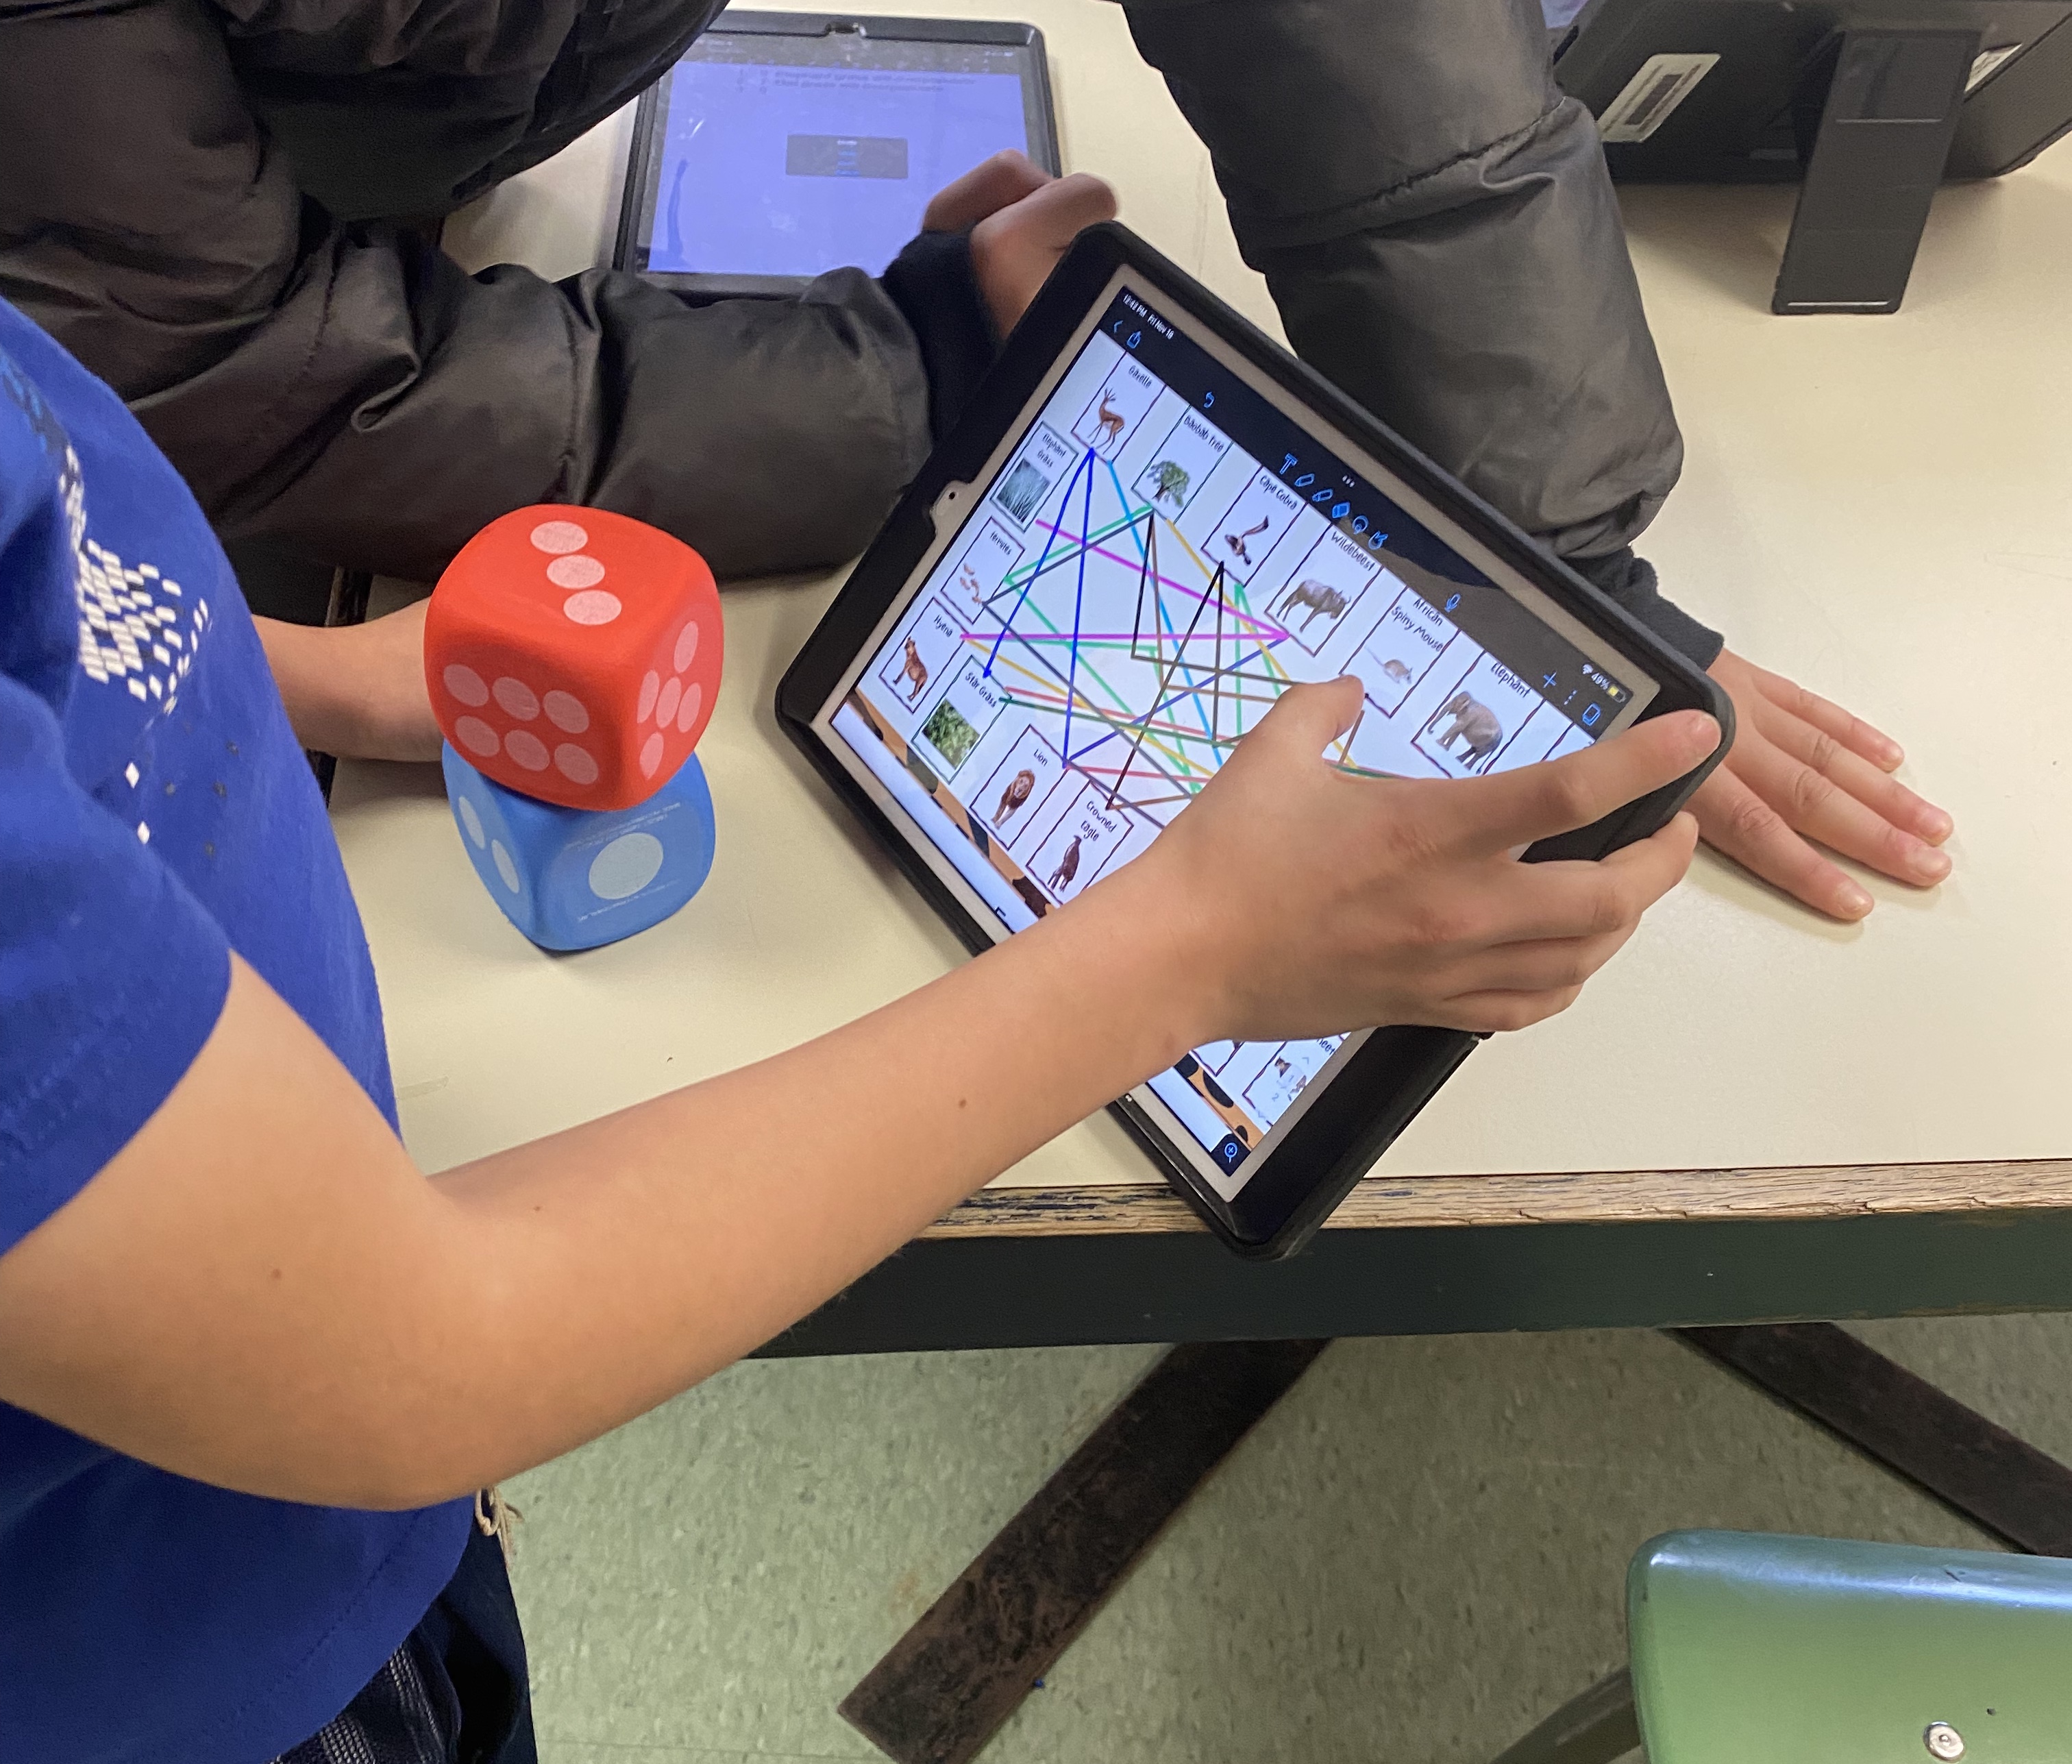
I start with Google Earth because it draws them in. First, they find their house, then they “drive” to school, a friend’s house, or the mall. They love seeing the local park or mall in relation to everything else. Why not tap into that excitement to teach real map skills?
Getting Started: Teaching the Basic Map Skills
Teaching students how to plot on a map can feel intimidating, but it becomes like solving a puzzle. They get excited when they find the right location.
Although their social studies teachers may teach longitude and latitude, I don’t assume students remember them. I go over the prime meridian and the equator to use as our “home bases.” All of the points on the map are in relation to those two lines. The prime meridian, 0° longitude, runs from the North Pole to the South Pole. The equator, 0° latitude, separates the northern and southern hemispheres.
I explain how locations are described in degrees north, south, east, or west. We practice plotting points close to the equator or prime meridian to start building confidence. Then we plot familiar places like Disney World or Cape Canaveral. Here are some coordinates to practice.
Disney World, Florida– 28.3852°N Latitude and 81.5638°W Longitude
Niagara Falls, New York– 43.0815°N Latitude and 79.0642°W Longitude.
Cape Canaveral, Florida– 28.3922°N Latitude and 80.6077°W Longitude.
Washington Monument, Washington, D.C.– 38.8894°N Latitude and 77.0352°W Longitude.
San Diego Zoo, California– 32.7356°N Latitude and 117.1515°W Longitude.
Eiffel Tower, Paris, France– 48.8582°N Latitude and 2.2945°E Longitude.
London Bridge, London– 51.5078°N Latitude and 0.0878°W Longitude.
Students love to look up the coordinates of their favorite places such as their houses, school, vacation spots. etc. We use two different web sites, https://www.latlong.net and https://www.gps-coordinates.net to find the coordinates. I like to have the students find each other’s special locations on local maps.
Estimating Between Two Grid Lines on the Map
One tricky part is when a point doesn’t land exactly on a latitude or longitude line. For example, if a map shows lines at 50° and 60°, how do they plot 53°?
I prepare students to estimate by drawing a one foot line on the board and having them practice guessing one-third, one-half, or three-fourths of it. They’re usually better at estimating than they think!
The key to finding an in-between point is finding the halfway point first. If they’re plotting 53°, they know it’s just slightly less than halfway between 50° and 60°.
Having Students Check the Accuracy Of Their Plot Points
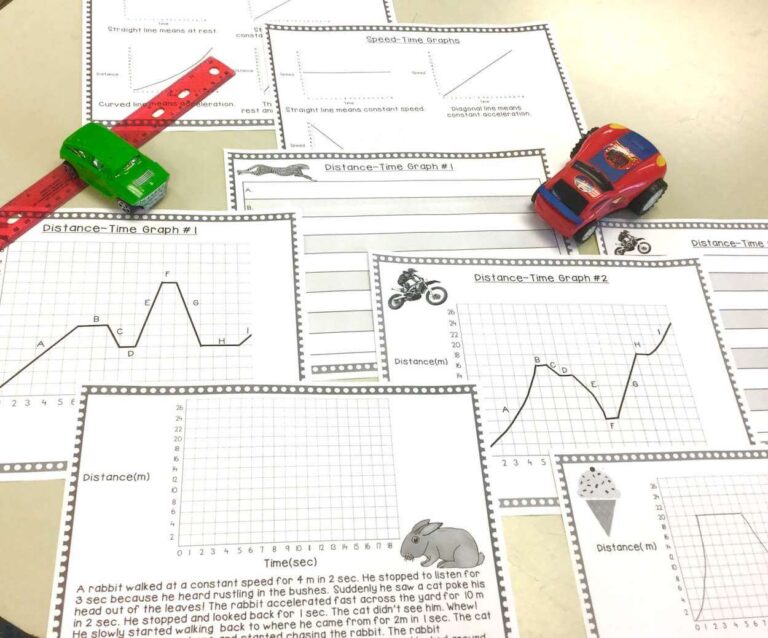
When plotting earthquakes or volcanoes, (Move the Plates! Teaching Plate Tectonics is Fun), I provide a map labeled with countries. Many students can’t locate places like Indonesia or even Japan. This can cause the student to not realize that their plot point is incorrect. Checking for accuracy is important for seeing patterns—if the points are wrong, they won’t notice the plate boundary pattern on their map when we move onto the next activity.
Plotting Earthquakes and Volcanoes
I don’t teach map plotting in isolation. It’s now part of my plate tectonics unit. We start with plotting earthquakes, which takes them around the world, even into the oceans. For some reason, ocean plot points can make students nervous! (they are convinced they are wrong).
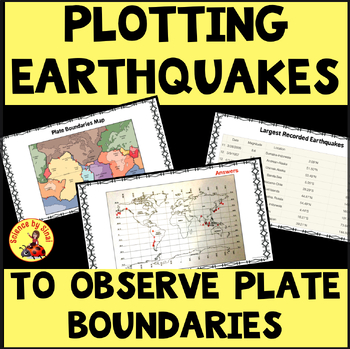
As they plot earthquake locations, they start seeing patterns that outline plate boundaries. When they step back and see the connection between the points and the plates, it’s a moment where all the complicated latitude and longitude work makes sense.
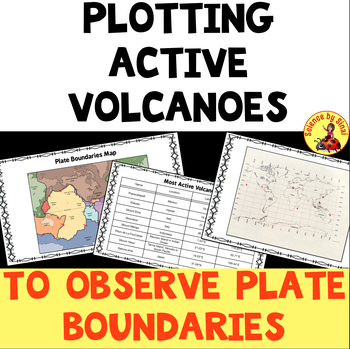
Then we move on to plot volcanoes. The pattern is similar, which helps reinforce the concept of plate boundaries and the “Ring of Fire” around the Pacific Plate.
Conclusion
Teaching map skills might seem outdated in a GPS world, but it’s worth the effort. It’s not just about finding places—it’s about seeing relationships, building spatial awareness, and connecting to the bigger picture.
Please check out my plate tectonic unit and earthquake and volcano plotting activities on Teachers pay Teachers at Science by Sinai.

- Embracing The Mess: Why a “Messy” Science Classroom is a Good Thing
 Embracing The Mess: Why a “Messy” Science Classroom is a Good Thing Do you have a messy science classroom? Are supplies scattered everywhere, with half finished…
 - Why Digital Science Notebooks Make the Ultimate Study Guide
 Why Digital Science Notebooks Make the Ultimate Study Guide Do you find that your students don’t know how to study for tests?Are they losing papers, forgetting…
 - Christmas Science Activities to Keep Students Engaged
 Christmas Science Activities to Keep Students Engaged Are you looking for some Christmas cheer in your science classroom but you want to stay on curriculum? I…