How to Interpret Distance-Time and Speed-Time Graphs
Do your students need practice interpreting distance-time graphs and speed-time graphs as part of your motion and forces unit?

written by
Karen Sinai
How to Interpret Distance-Time and Speed-Time Graphs
Jan 2021
By the time your students finish this activity called Interpreting Distance-Time Graphs and Speed-Time Graphs Unit, they will have a good understanding how to read the slope on a motion graph. By adding some stories and having them make their own graphs, they will truly own the concept!
NGSS Standards Covered
I have found that most middle school teachers use these in 8th grade as part of the MS-PS3-1 which states: Construct and interpret graphical displays of data to describe the relationships of kinetic energy to the mass of an object and the speed of an object. This also covers the concepts included in HS-PS2-1 Motion and Stability: Forces and Interactions- Analyze data to support the claim that Newton’s second law of motion describes a mathematical relationship among the net force on a macroscopic object, it’s mass and it’s acceleration.
Introduce Speed First
Students need to be completely familiar with the speed equals distance divided by time formula before you can move on to learning distance-time graphs or speed-time graphs. I started the unit with my finding speed Zombie Calculating Speed Indoor or Outdoor Running Activity where we went outside and set up a starting and finish line. Students used their iPads as stopwatches and then found the speed of themselves walking, walking backwards, running and then walking like a zombie. They can be crazy creative and they learn how to use the formula and finding average speed.
We then move onto my Pullback Toy Car Speed Lab Activity where they have a starting and finishing line and they watch how the difference in potential energy and mass affects the speed of a pullback car. That project is outlined in my blog post called Making Speed and Acceleration With Pullback cars! By the time they finish the multiple calculations, average speeds and reflection questions, they have a very good handle on the concepts.
Create Interest in Speed Using Cheetahs
Students love cheetahs and discussing the aspects of their speed is fascinating to them. I have them read a passage and answer questions for comprehension.
After we go over them we watch this amazing short video.
Learn the Distance-Time Slopes
Starting with the distance-time graphs, I start relatively slow as we look at the page of the four different slope examples. I did this with my eighth graders and most of them have done some sort of graphing and slope work in eighth grade math. If that’s not the case then I just move a little bit slower.
A list of keywords are included in my product to make sure that the students understand how forces are either balanced or unbalanced. They learn that this imbalance can cause a change in motion or no change at all. A discussion of acceleration and deceleration is also important along with how to interpret the difference slopes on the graphs.
Interpreting the Slope Shapes
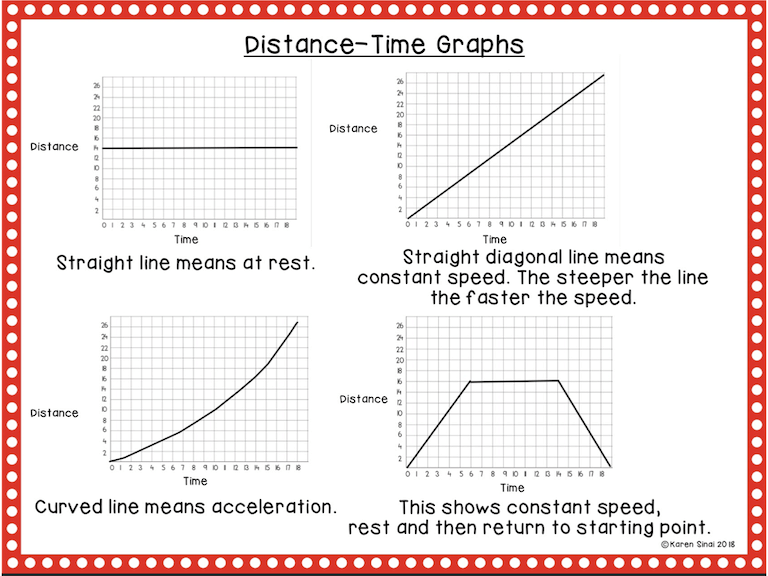
On a distance-time graph a straight line is interpreted as being at REST. (This will be different on the speed time graph). Before moving on to the rest of the activity, make sure that the students always check the labels on the axes to make certain that they know which type of graph they are viewing.
On a distance-time graph a diagonal straight line means CONSTANT SPEED. (This will be different on the speed time graph.)
On a distance-time graph a curved upwards line means ACCELERATION and a line that returns down to the baseline means RETURNING BACK to the original starting point(0 line on the graph). Again, different on the speed time graph.
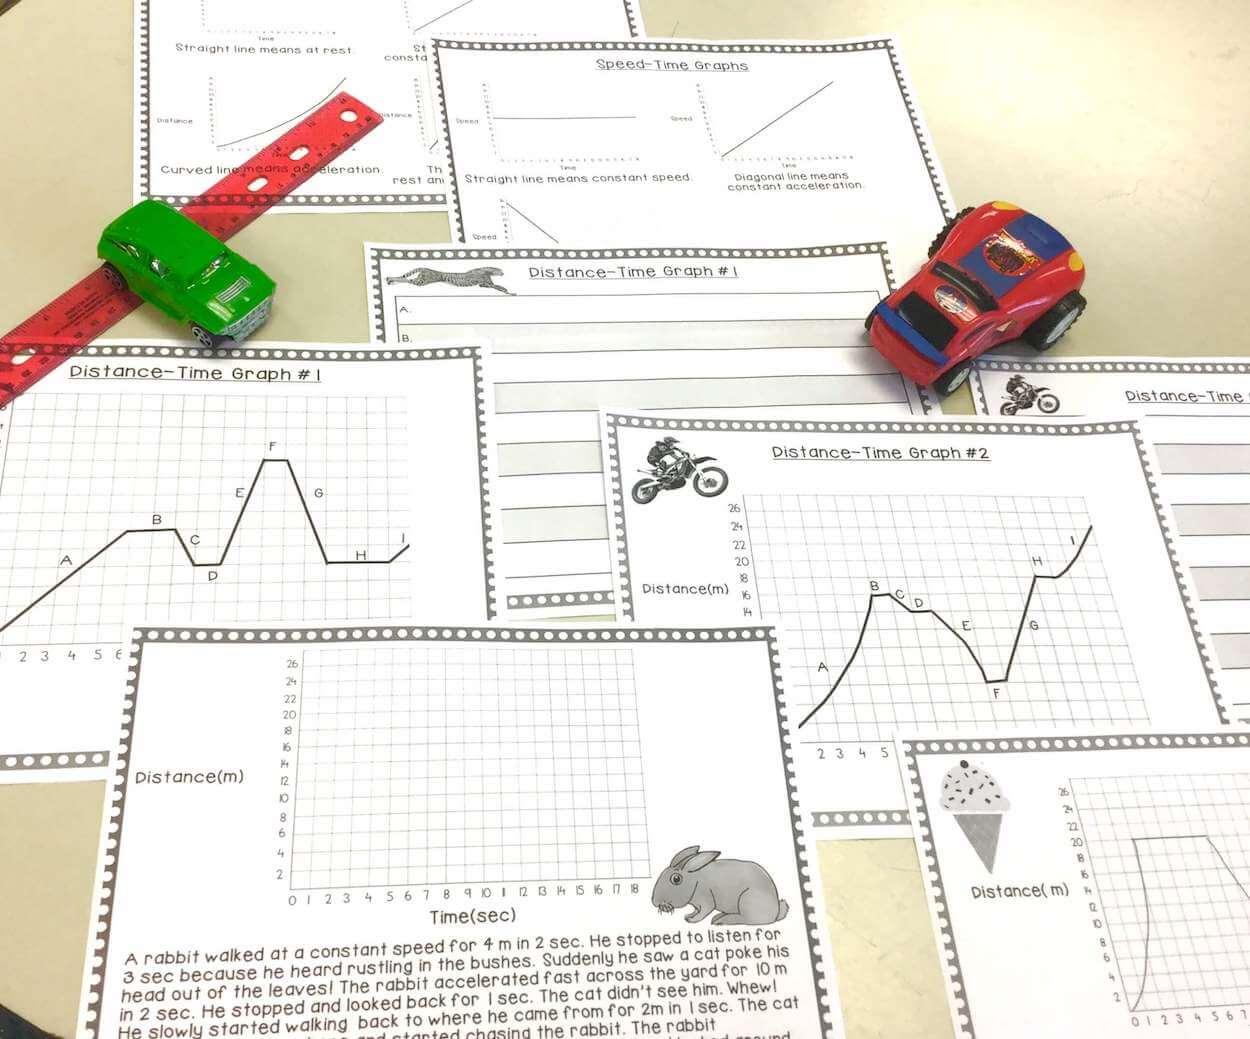
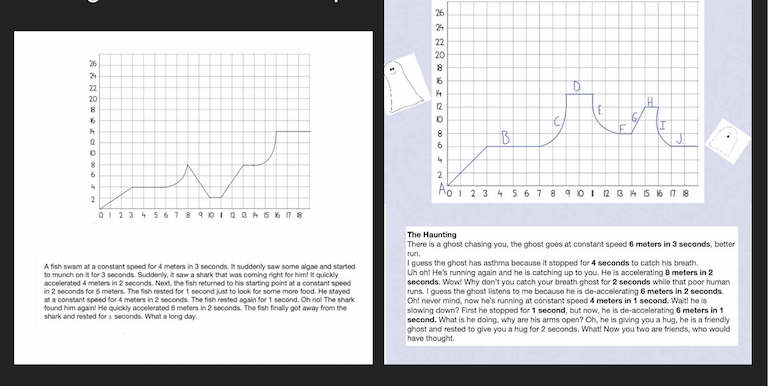
In this product there are three distance-time graphs for the students to interpret. Since we use digital science notebooks in my classroom, we load those into their Google Slides, but you could easily print them out.
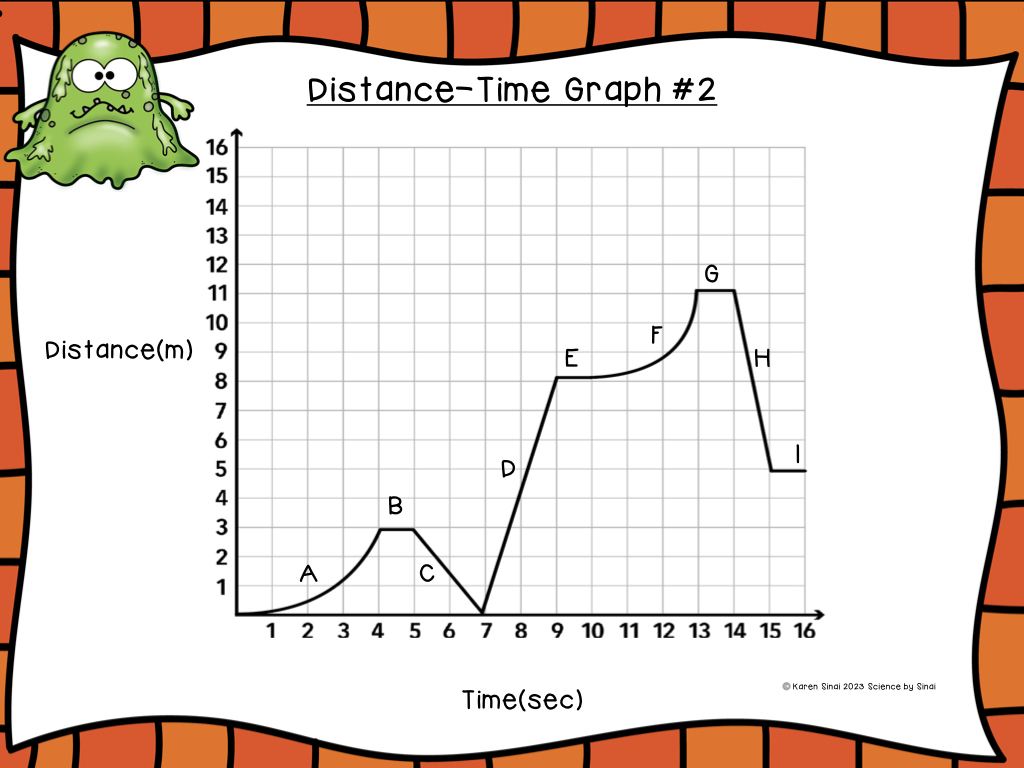
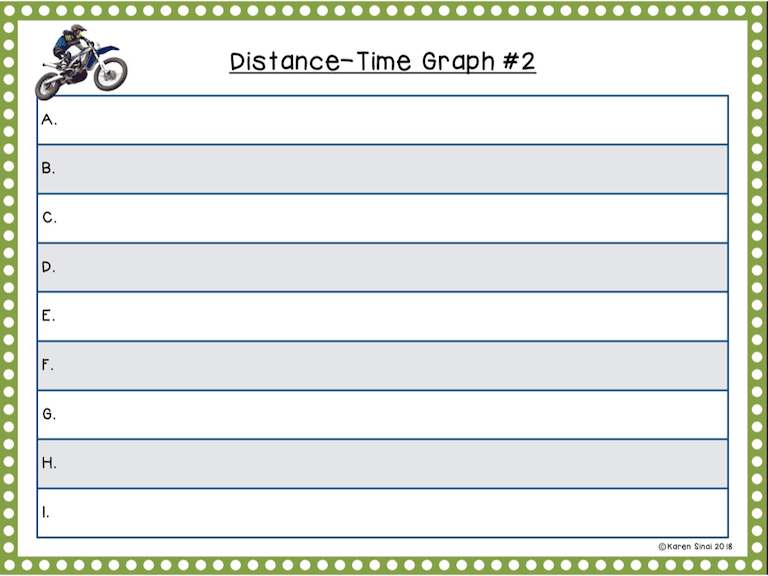
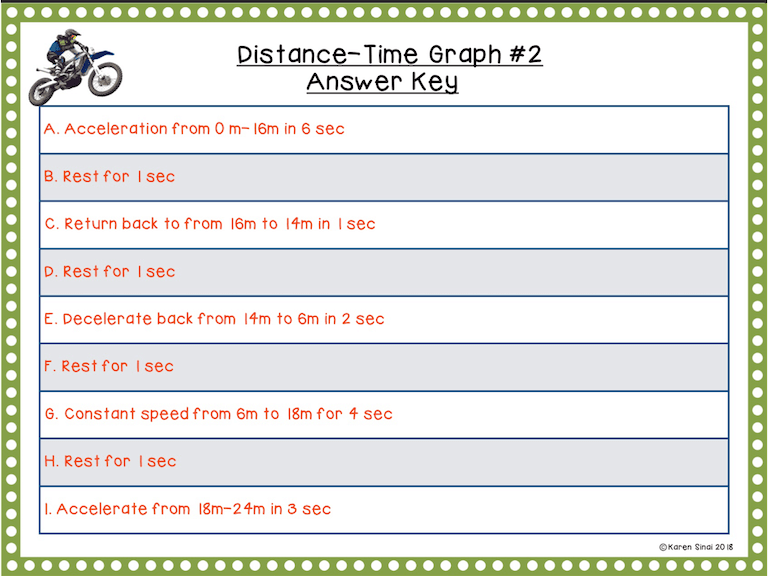
The first three graphs are distance-time graphs so make sure the students understand that the units of distance are in meters and time is in seconds. Each individual slope is labeled with a capital letter and the students interpret them and write them on the chart on the answer slide.
I generally do the first five or six segments together as a class until they get the rhythm of how to fill out the answer sheet. I recommend printing out the reference slide, with the slope types, or creating an anchor chart in the classroom. Projecting the answers for them to check themselves, after they complete the first graph, is useful and builds confidence.
Interpret a Story Into a Graph
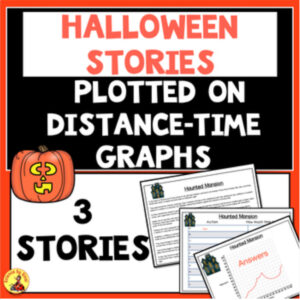
After interpreting the first three graphs, the students are now ready to move on and draw their own graphs. Drawing their own slopes is a little bit harder, but the students really enjoy it. They read the paragraph very carefully and draw their own slope on the empty graph. Each sentence of the story represents one segment where the students need to determine how far the subject traveled and then for how long.
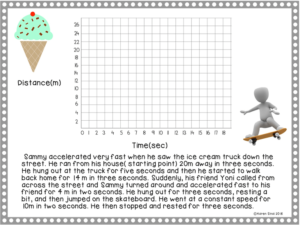
One story is about Sammy running after the ice cream truck and the other is a story of a rabbit running away from a cat. I have included the answers in the product.
Students were extremely satisfied when they got the correct shape at the end. It was useful to have the students that moved through it quickly help the ones that were struggling a bit. Again, we projected the results for them to see the answers.
Not a part of my product, but something that has been very successful over the years, is having the students write their own stories and exchange it with one other class member. Their partner has to read their graph and draw the slope on an empty grid. I recommend that they draw their slope segments first and then write a story about what is going on in each segment. Some of their stories are really funny!
One year, with a particularly advanced class, I had them act out their stories with toy cars or plastic animals and we made a video. They split the screen and showed the slope segment as the car was moving.
Introducing Speed-Time Graphs
Just when the students were feeling comfy with all of the slopes on the distance-time graphs, I threw a twist in with new meanings to the different shaped slopes as I introduced speed-time graphs! There’s usually a collective groan from the students when I show them the second page with the new interpretations!
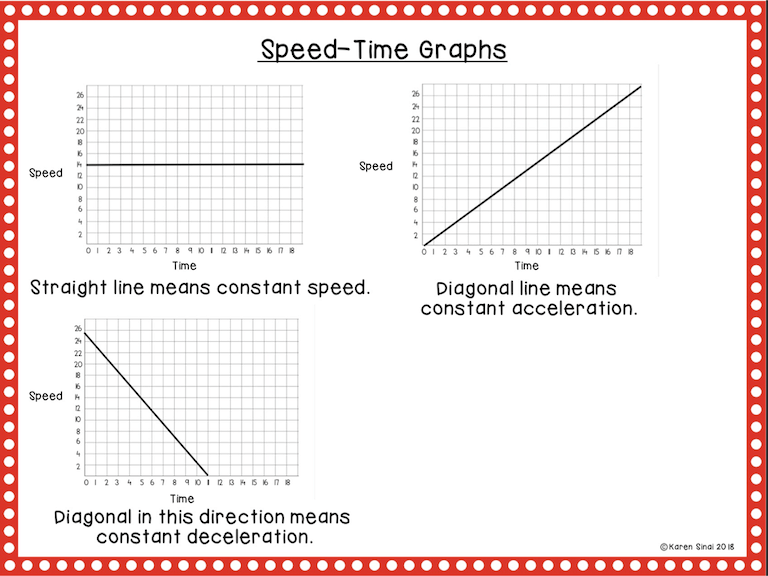
It is important for the students to understand that on a speed-time graph a straight line represents CONSTANT SPEED. A diagonal straight line means CONSTANT ACCELERATION. On a speed-time graph a diagonal line coming back to the baseline means CONSTANT DECELERATION .
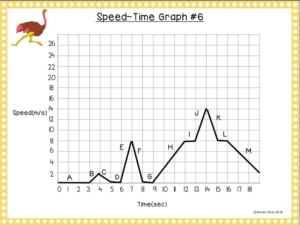
Graphs #4-#6 are speed-time graphs with the same format of the individual slopes being labeled with capital letters. Make sure the students realize that the units are meters per second and seconds.
Again, we do the first of the three graphs together and then I let them work on their own.
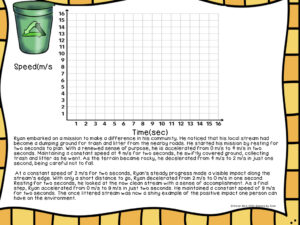
Turning a Story into a Speed-Time Graph
Similar to what we did with the distant time graphs, I give the students a story that they need to interpret. They read the paragraph and carefully add the segments onto a blank graph.
There is one speed-time graph story in the product for the students to try. They could also write their own as a good homework or substitute assignment.
The More Practice the Better
I like to reinforce the concepts of these graphs as often as possible and why not use games? The first set uses matching cards and there are actually two activities that involve interpreting motion graphs. The set of matching cards has the students looking at either a distance-time graph or a speed-time graph and they match it with a description of what is happening on each segment. The second is a set of motion graphs, that each have five segments, and the students need to fill out what is going on with each segment.
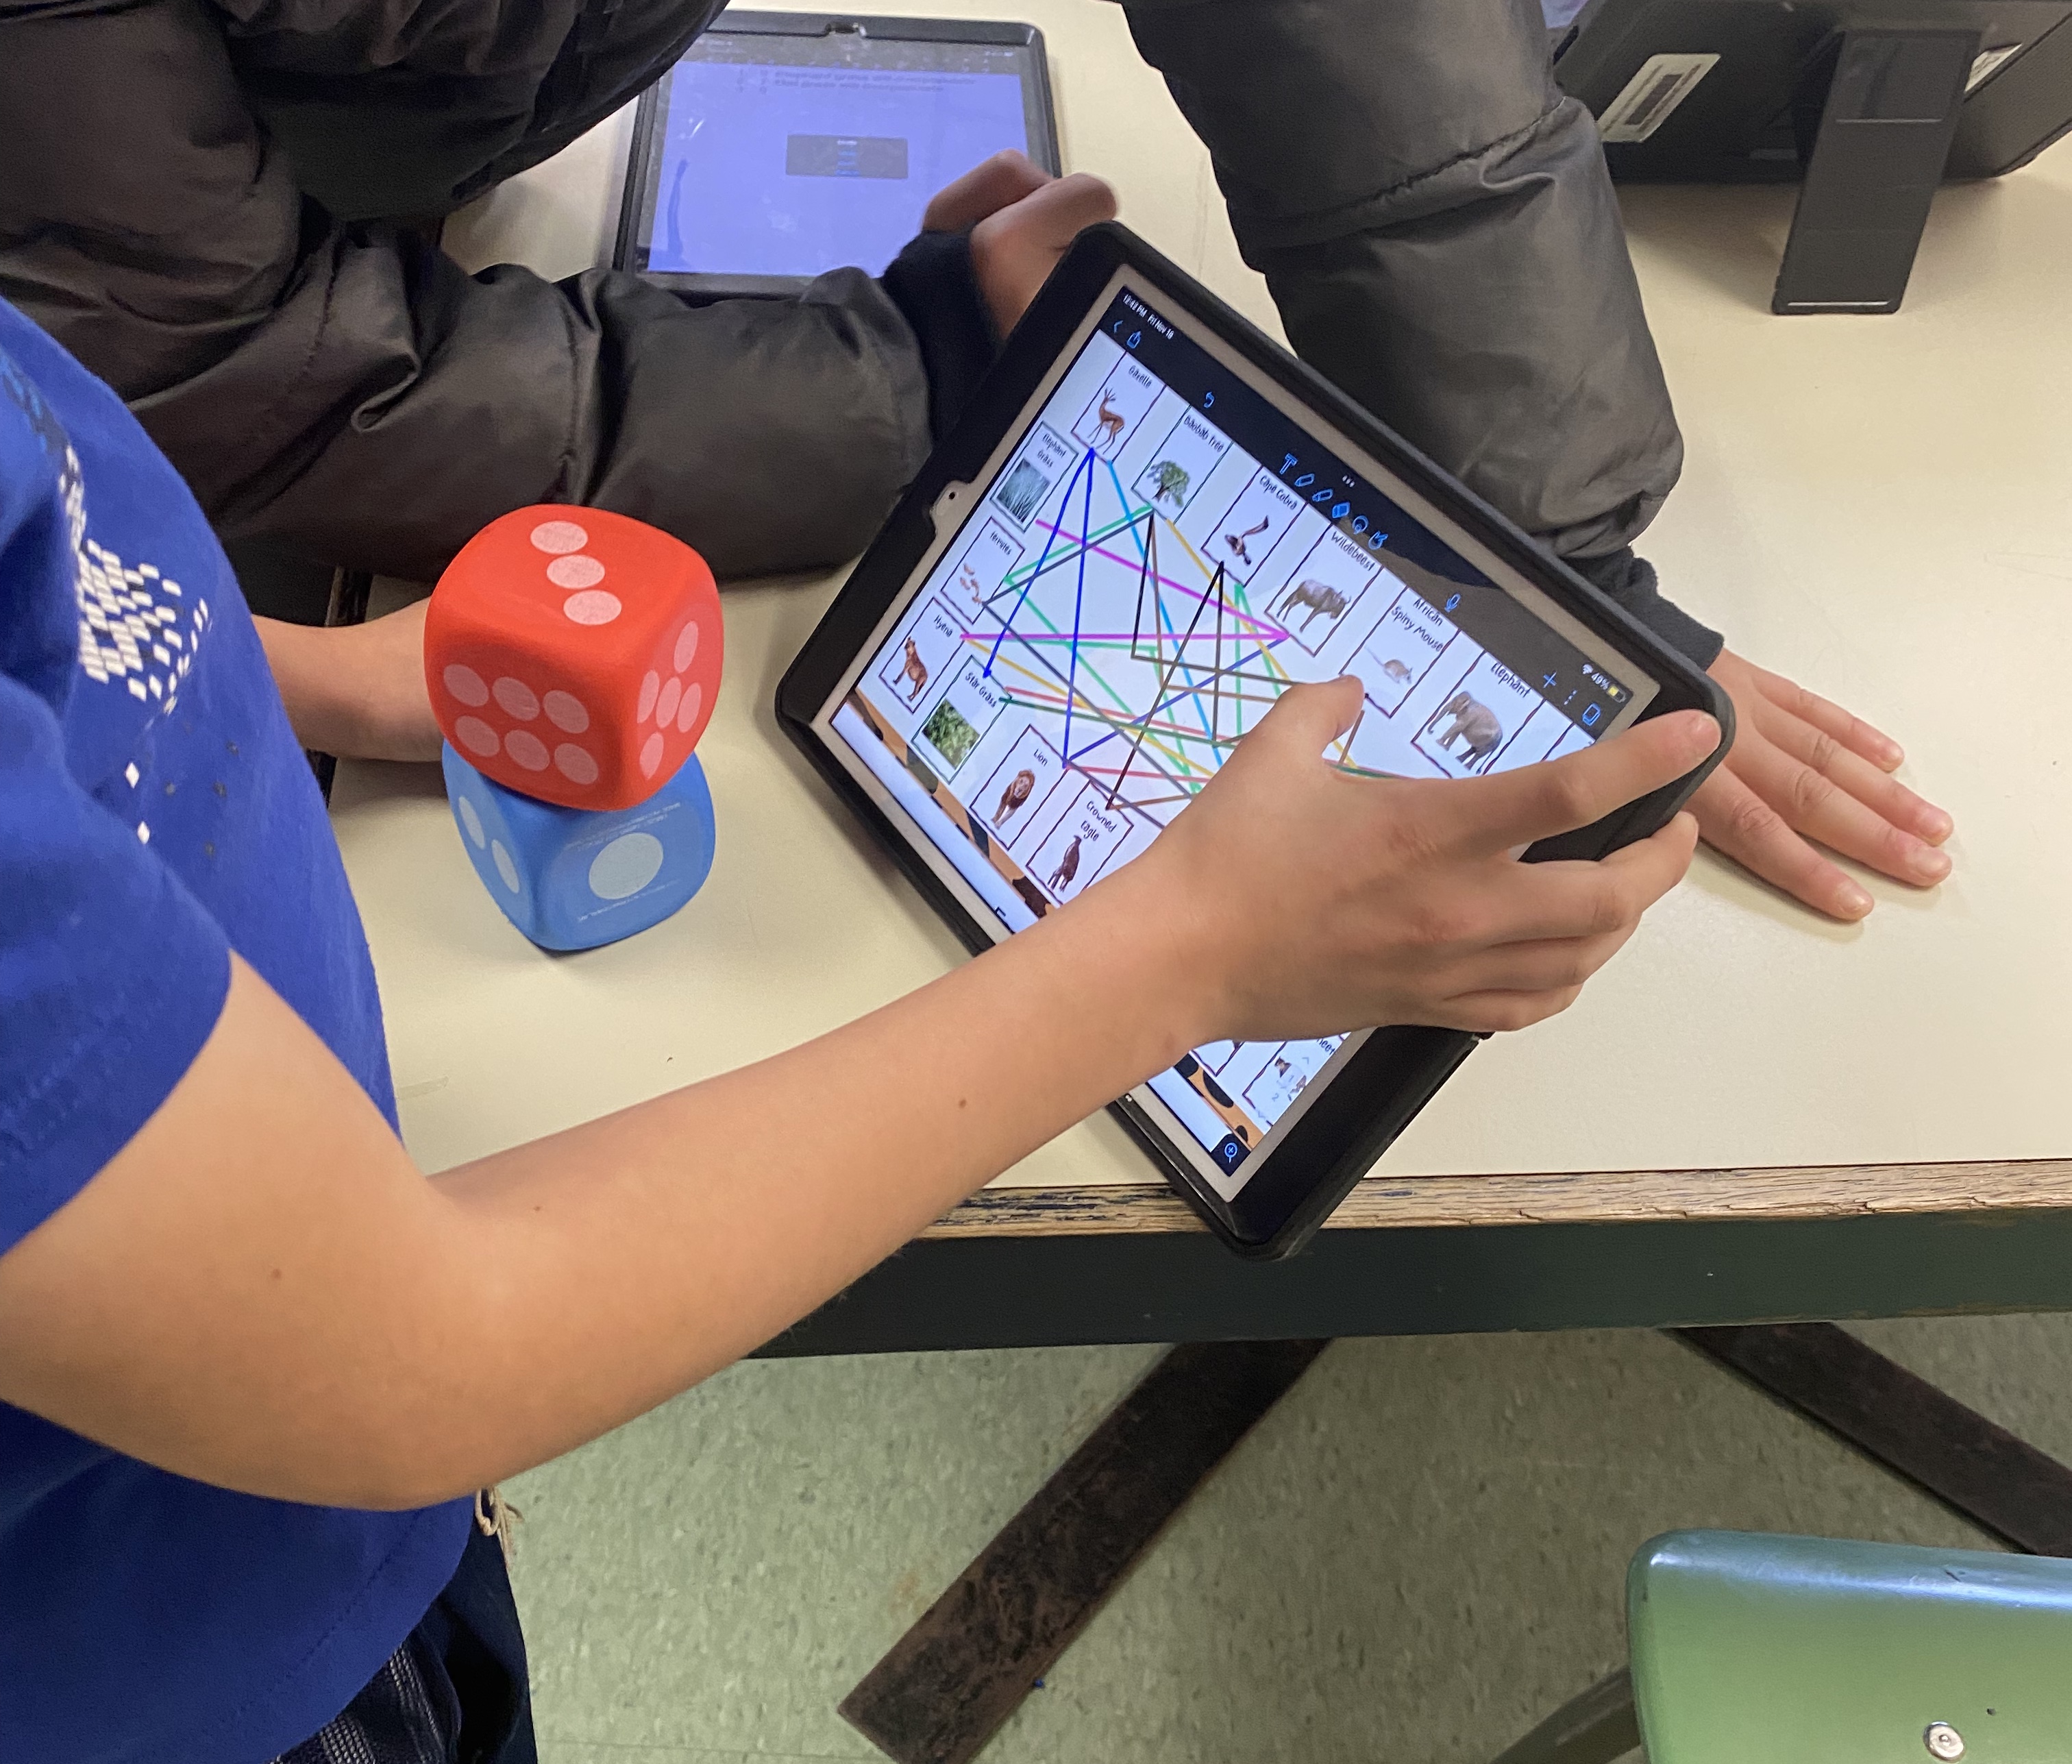
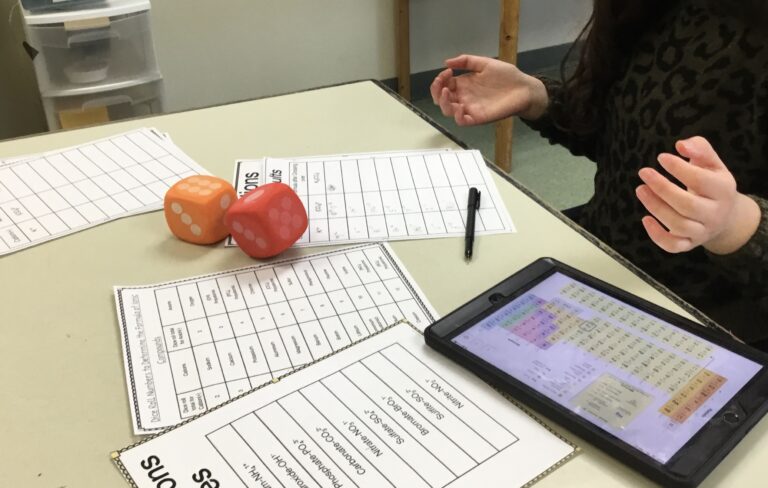
The second activity is a fun dice roll game where students draw the slope of motion on distance-time graphs and speed-time graphs. The leader of the group throws the dice and students match the numbers from the dice to a chart that tells which motion path to draw on the graph. It’s so easy to access at a glance because all the students in one group should have the same results!
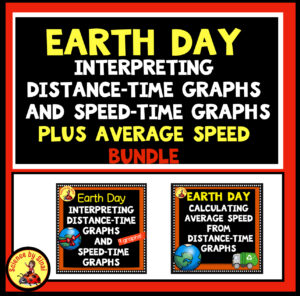
Extensions With Finding Average Speed
This is a separate product that has them analyze distance time graphs to determine the average speed at any one point. This really helps students understand how much information is actually represented on these graphs!
An Entire Unit Ready to Go
I’ve put together my entire unit on motion graphs for you. Basically no prep or low prep for all of the activities. Students will have a great understanding of the concept once you complete these activities.
Looking for science resources? Please visit my store at Teachers pay Teachers called Science by Sinai for hundreds of activities.

- Embracing The Mess: Why a “Messy” Science Classroom is a Good Thing
 Embracing The Mess: Why a “Messy” Science Classroom is a Good Thing Do you have a messy science classroom? Are supplies scattered everywhere, with half finished…
 - Why Digital Science Notebooks Make the Ultimate Study Guide
 Why Digital Science Notebooks Make the Ultimate Study Guide Do you find that your students don’t know how to study for tests?Are they losing papers, forgetting…
 - 10 Tips For Engaging Disinterested Students
 10 Tips For Engaging Disinterested Students We all know the struggle of engaging disinterested students no matter how hard we try. Over the years, I’ve found…


As a student, this was quite helpful, considering my test on this subject is in 10 minutes 😀 Thank you!