The Importance of Teaching Graphing on Both Paper and the Computer
Are you realizing the importance of teaching graphing on both paper and the computer? Are your students simply entering the data on their devices, and making “pretty” graphs, without really understanding what they represent?

written by
Karen Sinai
The Importance of Teaching Graphing on Both Paper and the Computer
July 2024
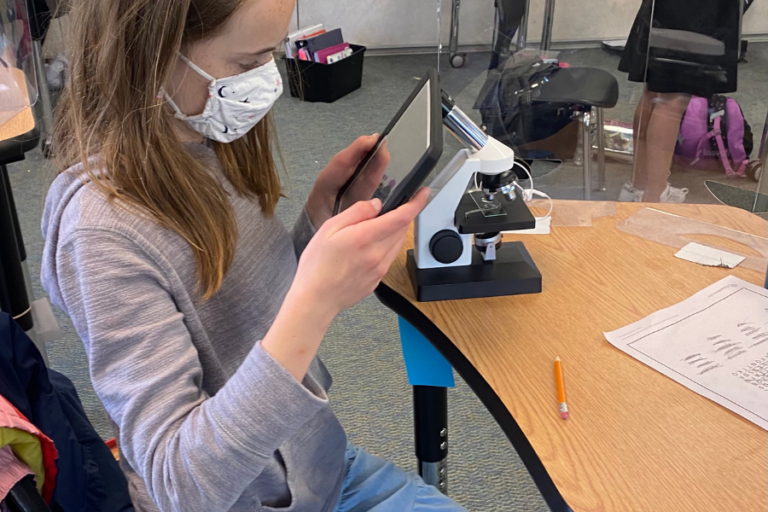
You know me. I’m all about the digital notebook, but teaching graphing on paper has become my exception!
I am realizing that the students need to go back to the basics of graph paper and pencils to really understand how graphs work. Yes, they will whine. Yes, it can be tedious and a bit slow moving. But… you will find that your students understand the numbers that you are working with at a much deeper level!
Why Is It So Important For Students To Learn to Graph?
We need to get across the point that graphing is a language that is used by scientists along with a lot of other professions in the world. From the perspective of our science classroom, we want to be able to organize data visually so that we can see trends at a glance, see discrepancies in the data quickly, and compare graphs around the room.
Answering the Question “Why Do We Have To Learn This?”
The dreaded question! Guaranteed to be asked if the work takes effort and critical thinking! We need to be ready with TONS of examples. Start by asking what they want to do for a living.
Want to go into business?
Businesses use graphs to analyze market trends, sales performance, consumer behavior, unemployment rates, inflation trends, etc.
What about a career in Engineering and technology?
Engineers use graphs to refine product designs, analyze stress tests and track market trends.
What if you want to be a farmer?
Agricultural scientists graph the yields of crops, soil quality, weather conditions and use of fertilizer. They may also use graphs to track the health and growth of livestock.
How about a rocket scientist?
Atronomers graph data on various stars, planets and other space structures along with extensive data for space missions.
In everyday life we have fitness tracking where people will graph physical activity, heart rate and other training goals.
In our private lives we have financial planning where we graph our income, expenses and investments to help make informed decisions.
Even a gamer tracks their progress with an improvement graph!
How Can You Make Graphing More Interesting?
I always start off teaching graphing by having the students gather data about themselves and their classmates. Each student designs a quick survey to go around and ask each other.
Typical surveys may be favorite color, favorite movies out of a choice of five, number of countries visited, types of pets, etc. They LOVE going around and interviewing each other and creating data charts.
Then we sit down with graph paper and graph the results into bar graphs. I have found that starting with bar graphs tends to make more sense to students.
Introducing a line graph can be done simply by using the student’s heartbeat overtime. Since a lot of students have trouble finding their heartbeat at rest, we start collecting data after they have done 25 jumping jacks or something equivalent. This ensures that their heart rate is up and easily counted. We count for 10 seconds and then multiply it by 6 to get our beats per minute. We do this every 2 min for 16 minutes. They now have a data chart with several readings that we can plot on a line graph.
Personal Air Pollution Survey Graphing Activity
During our human impact air pollution unit, I have the students track their family car for several days. They record how far and where they went. We then classify the data into the types of trips that the car went on such as luxury, semi luxury or necessity. Of course, we keep our privacy very high.
The students use the data that they have collected to graph the trips in several different graphs. I have the students do the first two graphs on paper and then we do the rest on their devices. The graphs mean more to the students since it is personal data. They are more likely to catch any mistakes if they know their own data well. (Teaching Students About Their Individual Affect on Air Pollution).
Graphing From Real World Data
I’m a big advocate of students using real-world data to graph information and then analyzing the visual results. Since most of us teach environmental science, I have several environmental situations where the students will take the information from the data charts and make them into either bar or line graphs, depending on the situation. They complete reflection questions to make sure they understand what they are seeing. I have them start on paper and then do it again on their device to compare. There is a feeling of great satisfaction when their paper graphs look exactly like the computer graphs!
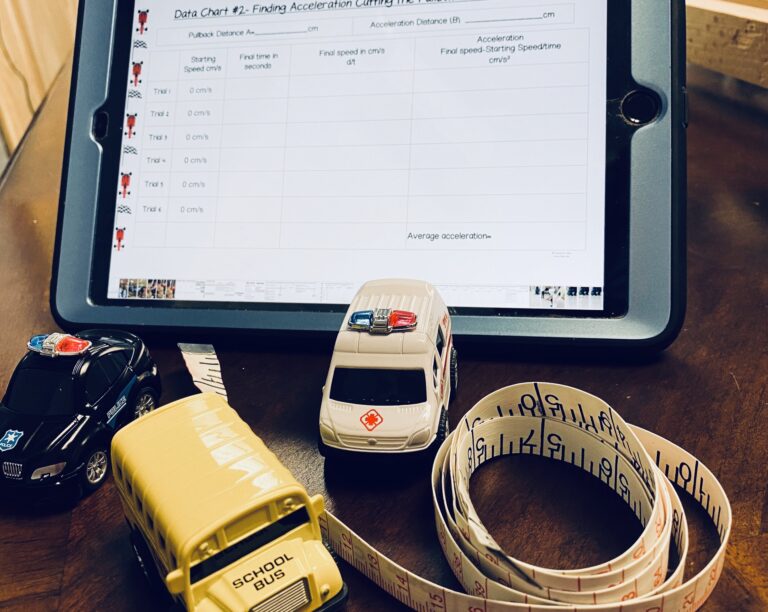
Learning To Interpret Motion Graphs
An important skill in middle school is understanding how to read motion graphs. I spend quite a bit of time on this unit because the skills are so valuable. Students learn to read and understand what is happening between each segment on the graphs. (How to Interpret Distance-Time and Speed-Time Graphs)
They also learn how to calculate average speed from two different points on a graph. Students are quite often surprised at how much information can be gathered from what looks like just a basic line graph. They understand that the graph is a “story” that they can tell from the motion overtime. As they finish up the unit, I have them write their own “stories” for each other to graph.
Graphing Throughout the School Year
I believe it is important to have multiple occasions throughout the school year to reinforce graphing as many times as possible. I like using real world data as a bell ringer at the beginning of a class for students to quickly analyze. These can be found on many science websites or even occasionally in the newspaper. Try to find high interest topics that may not be directly science but still echo the skills that we need for students to use.
Where Can You Get Data to Graph?
Here’s a good list to get started.
https://www.turnersgraphoftheweek.com
https://study.com/academy/lesson/using-tables-and-graphs-in-the-real-world.html
https://revopsteam.com/revenue-intelligence/data-visualization-real-life-examples
Conclusion
We all know that teaching graphing is super important, as part of our science curriculum, but we also know that it can be quite tedious to teach. It is worth it in the end for the skills that they take onward. I try to make a big deal about their paper graphs and even hang them up for others to see. Students are never too old to be proud of their work!
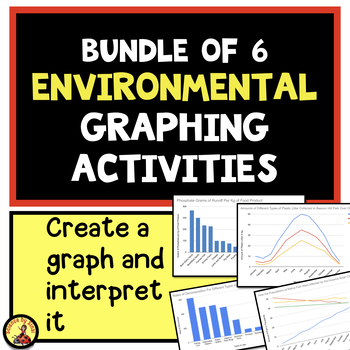
Please check out my graphing activities in my Science by Sinai, Teachers Pay Teachers store.

- Embracing The Mess: Why a “Messy” Science Classroom is a Good Thing
 Embracing The Mess: Why a “Messy” Science Classroom is a Good Thing Do you have a messy science classroom? Are supplies scattered everywhere, with half finished…
 - Why Digital Science Notebooks Make the Ultimate Study Guide
 Why Digital Science Notebooks Make the Ultimate Study Guide Do you find that your students don’t know how to study for tests?Are they losing papers, forgetting…
 - Christmas Science Activities to Keep Students Engaged
 Christmas Science Activities to Keep Students Engaged Are you looking for some Christmas cheer in your science classroom but you want to stay on curriculum? I…