Similar Posts
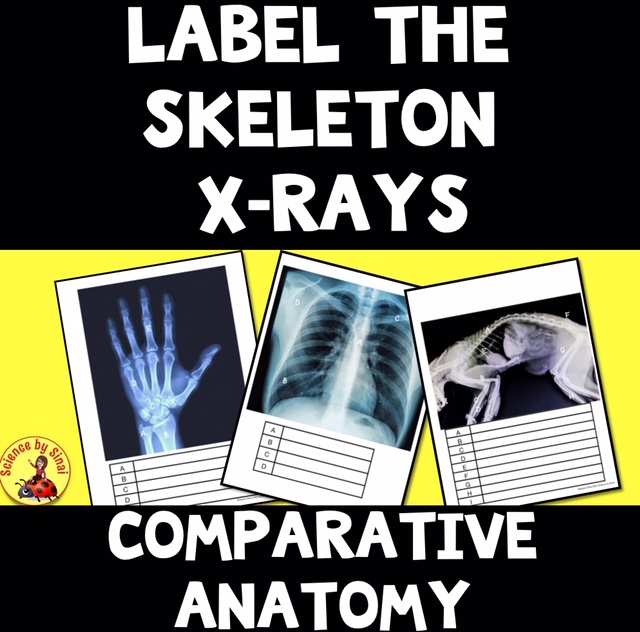
Label the Skeleton X-Rays – Comparative Anatomy
You need to be logged in to view this content. Please Log In. Not a Member? Join Us
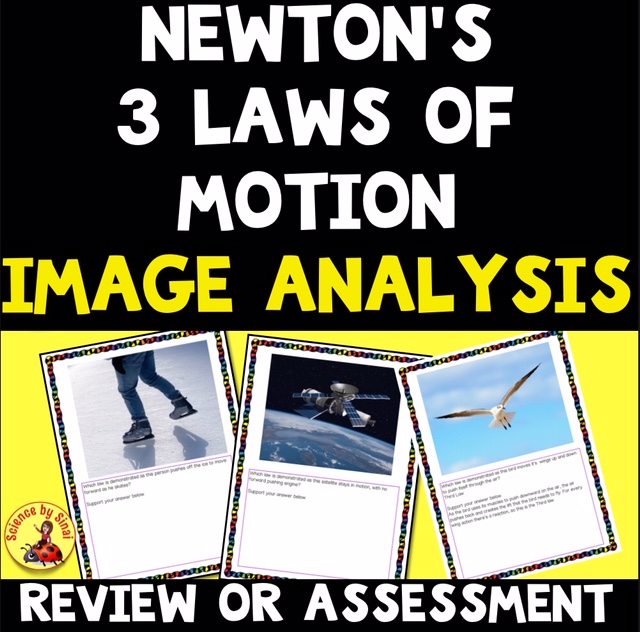
Newton’s Three Laws of Motion – Image Analysis
You need to be logged in to view this content. Please Log In. Not a Member? Join Us
How to Help Students Succeed in Science Class
How to Help Students Succeed in Science Class Are your students unsure how they can succeed in science class? Do they constantly ask how they can get an A in your class? We often assume that students have the tools to succeed in science class, but science is a completely different type of class than…

Fun Activities to Teach Physical and Chemical Changes
Fun Activities to Teach Physical and Chemical Changes Are you looking for ways to teach physical and chemical changes? This is such an important concept but it can be tricky for the students to understand. As I have mentioned in previous posts, I believe constant reinforcement, using different resources, is the way to ensure student…
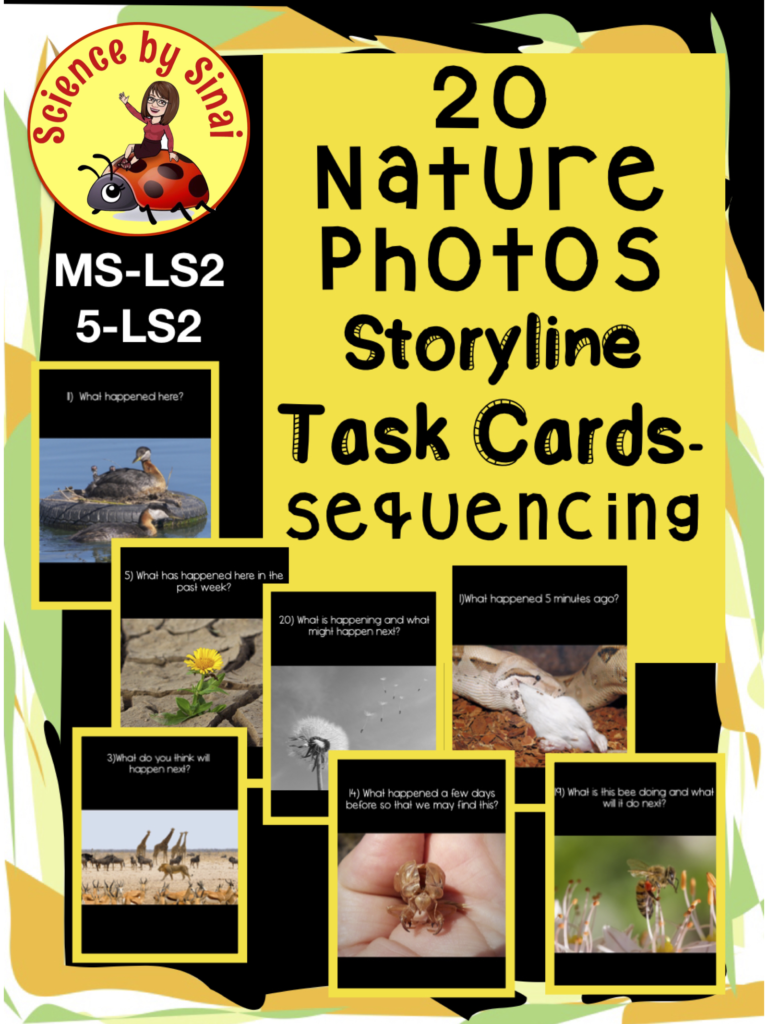
PREDICT THE NATURE STORY! Photo Prompt CER Task Cards Distance Learning
Can you figure out what happens next in this image? When following the NGSS MS-LS2 or 5-LS2 standards for studying ecosystems, animal and plant behavior, these full color, digital or printable, prompt photo task cards are very useful for using CER to explain the phenomenon of sequential events in nature. Each image has a question such as “what happened next?“ or “what may happen in the next 10 minutes?“. Students look at the given evidence in the photo and explain their reasoning. There can be many interpretations that get the students engaged and thinking.
There is a brief description for the teacher at the beginning of the slides to use as a prompt. I like to use my CER Templates while teaching with this product.

The Importance of Teaching Graphing on Both Paper and the Computer
The Importance of Teaching Graphing on Both Paper and the Computer Are you realizing the importance of teaching graphing on both paper and the computer? Are your students simply entering the data on their devices, and making “pretty” graphs, without really understanding what they represent? You know me. I’m all about the digital notebook, but…